
Page 96 - Unanet AE: Using Analytic Dashboard Designer
P. 96
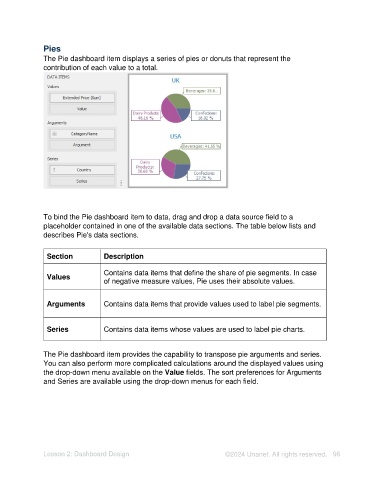
Pies
               The Pie dashboard item displays a series of pies or donuts that represent the
               contribution of each value to a total.


               To bind the Pie dashboard item to data, drag and drop a data source field to a
               placeholder contained in one of the available data sections. The table below lists and
               describes Pie's data sections.

                 Section           Description

                                   Contains data items that define the share of pie segments. In case
                 Values
                                   of negative measure values, Pie uses their absolute values.


                 Arguments         Contains data items that provide values used to label pie segments.


                 Series            Contains data items whose values are used to label pie charts.


               The Pie dashboard item provides the capability to transpose pie arguments and series.
               You can also perform more complicated calculations around the displayed values using
               the drop-down menu available on the Value fields. The sort preferences for Arguments
               and Series are available using the drop-down menus for each field.


               Lesson 2: Dashboard Design                                   ©2024 Unanet. All rights reserved.  96