Page 18 - Unanet AE: Using Analytic Dashboard Designer
P. 18
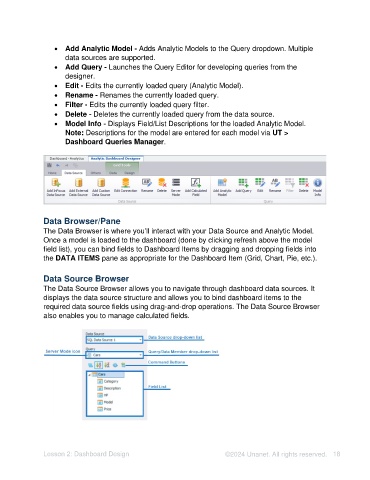
•  Add Analytic Model - Adds Analytic Models to the Query dropdown. Multiple
                       data sources are supported.
                   •  Add Query - Launches the Query Editor for developing queries from the
                       designer.
                   •  Edit - Edits the currently loaded query (Analytic Model).
                   •  Rename - Renames the currently loaded query.
                   •  Filter - Edits the currently loaded query filter.
                   •  Delete - Deletes the currently loaded query from the data source.
                   •  Model Info - Displays Field/List Descriptions for the loaded Analytic Model.
                       Note: Descriptions for the model are entered for each model via UT >
                       Dashboard Queries Manager.


               Data Browser/Pane
               The Data Browser is where you’ll interact with your Data Source and Analytic Model.
               Once a model is loaded to the dashboard (done by clicking refresh above the model
               field list), you can bind fields to Dashboard Items by dragging and dropping fields into
               the DATA ITEMS pane as appropriate for the Dashboard Item (Grid, Chart, Pie, etc.).


               Data Source Browser

               The Data Source Browser allows you to navigate through dashboard data sources. It
               displays the data source structure and allows you to bind dashboard items to the
               required data source fields using drag-and-drop operations. The Data Source Browser
               also enables you to manage calculated fields.


               Lesson 2: Dashboard Design                                   ©2024 Unanet. All rights reserved.  18

